In today’s fast-paced cloud-native world, ensuring the performance, availability, and security of your Kubernetes clusters is essential for delivering seamless services. Kubernetes provides immense scalability and orchestration benefits, but managing and monitoring such a dynamic system requires a robust monitoring solution. One of the best tools for the job is Grafana Cloud.
Why Use Grafana Cloud for Kubernetes Monitoring?
Grafana Cloud provides several key advantages:
- Comprehensive Observability: Out-of-the-box dashboards, metrics, logs, and alerts help you understand what’s happening in your Kubernetes clusters.
- Centralized Monitoring: Monitor multiple clusters and services from a single cloud-based interface.
- Scalability: With auto-scaling and multi-tenant features, Grafana Cloud can scale with your Kubernetes deployment.
- Alerting & Analytics: Create custom alerts and analyze trends based on metrics data.
- Ease of Integration: Seamless integration with Prometheus, Loki, and Tempo for a full observability suite.
Steps to Set Up Kubernetes Monitoring with Grafana Cloud
Let’s jump into the setup process and get your Kubernetes cluster monitored using Grafana Cloud.
Step-1: Installation and Running K8s Cluster
-
Make sure you have a kubernetes cluster up and running, for this demo we will use K3D you can use minikube, EKS, AKS etc
-
If you dont have a cluster then you can create one by using this Repo :- K3D Cluster Setup
Step-2: Sign Up for Grafana Cloud
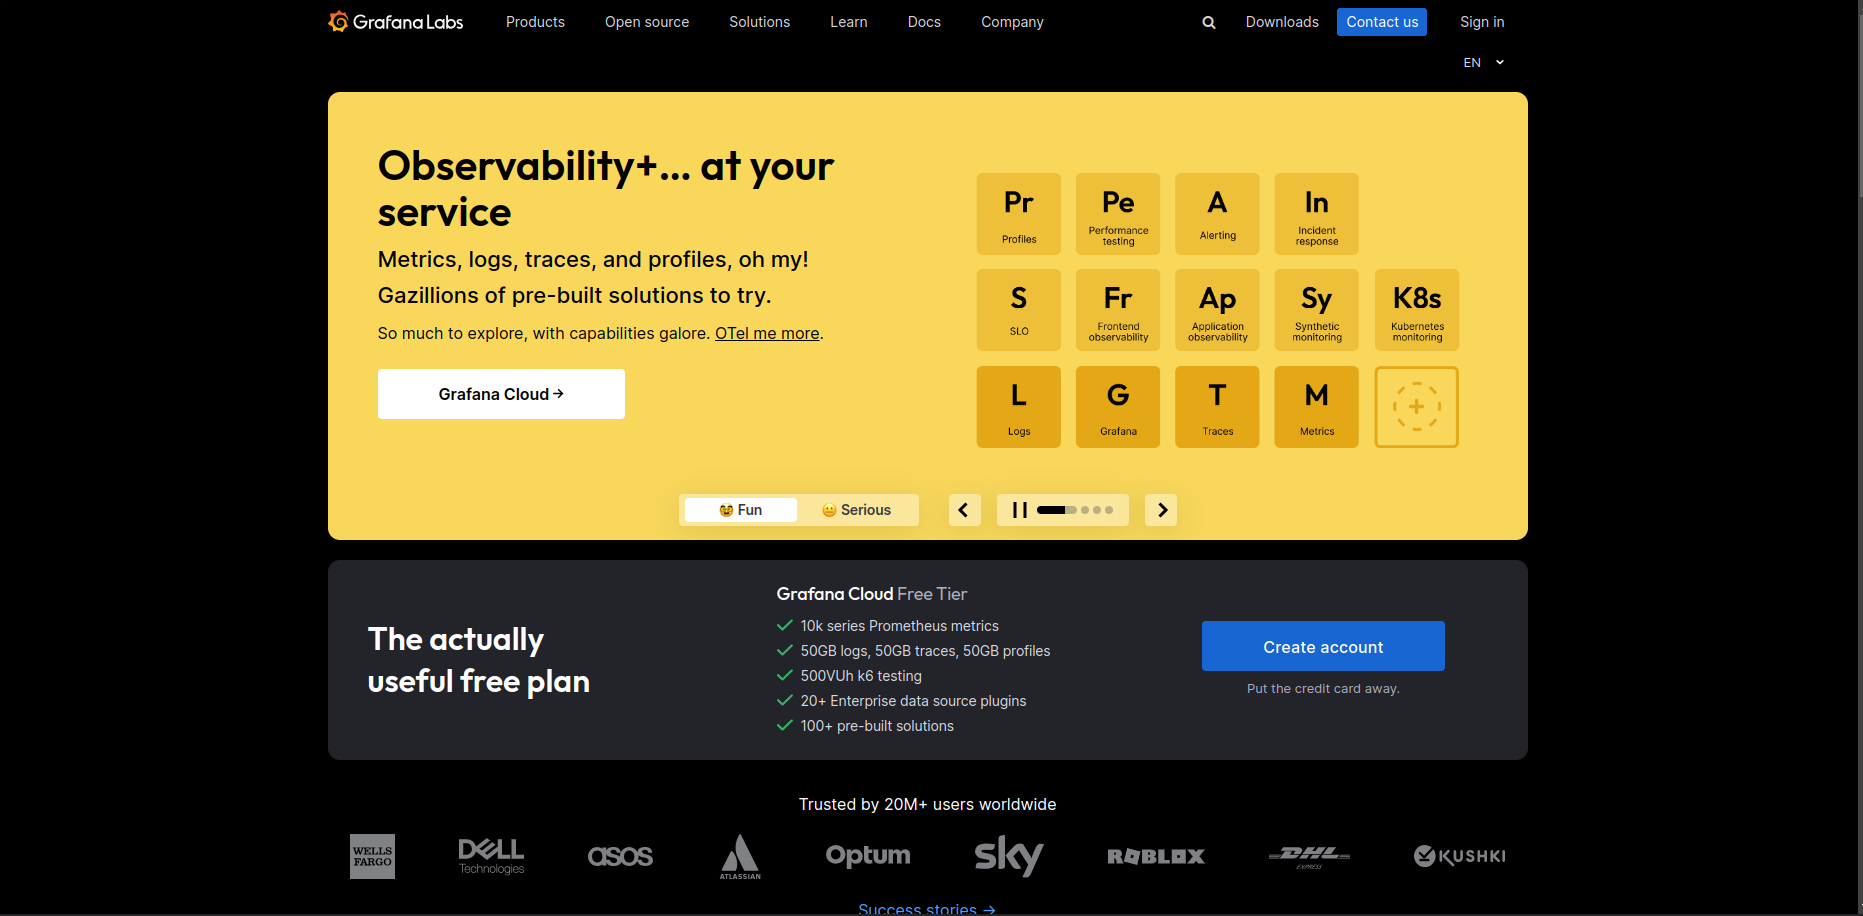
- Before anything, you’ll need to sign up for a Grafana Cloud account. Grafana offers free and paid tiers, so you can choose the one that fits your needs. After signing up, you need to configure your monitoring environment

- After Signing up you will be greeted with this screen and then you will be able to see your cloud stack
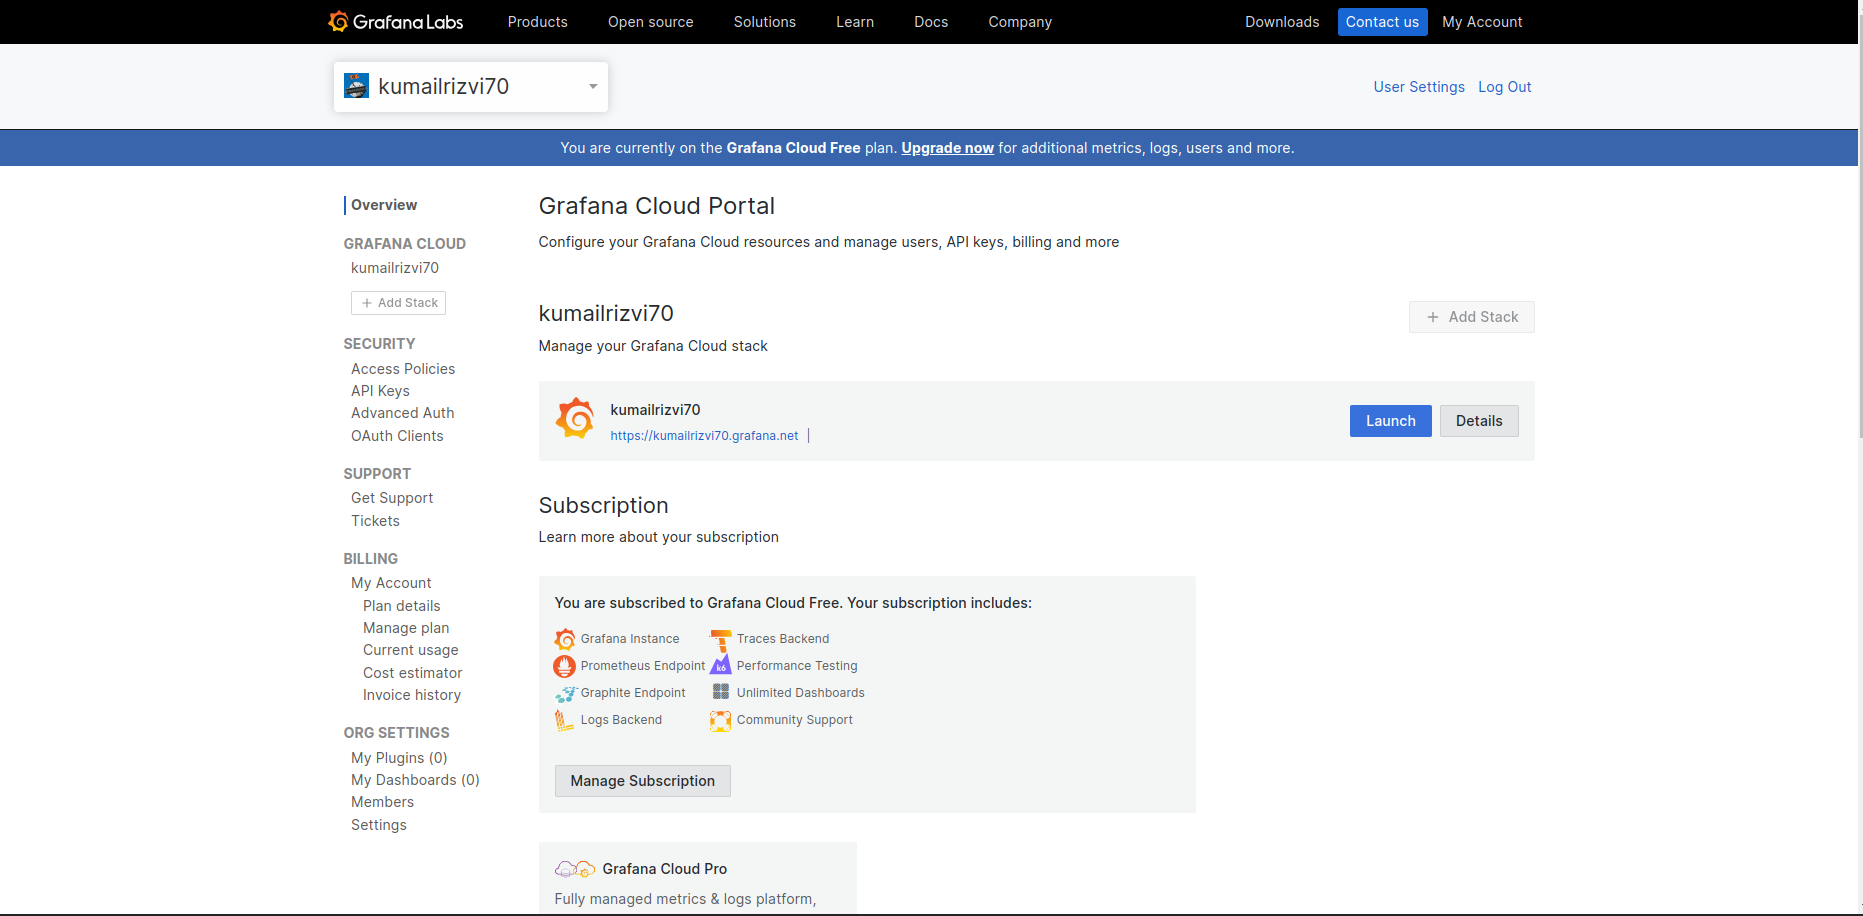
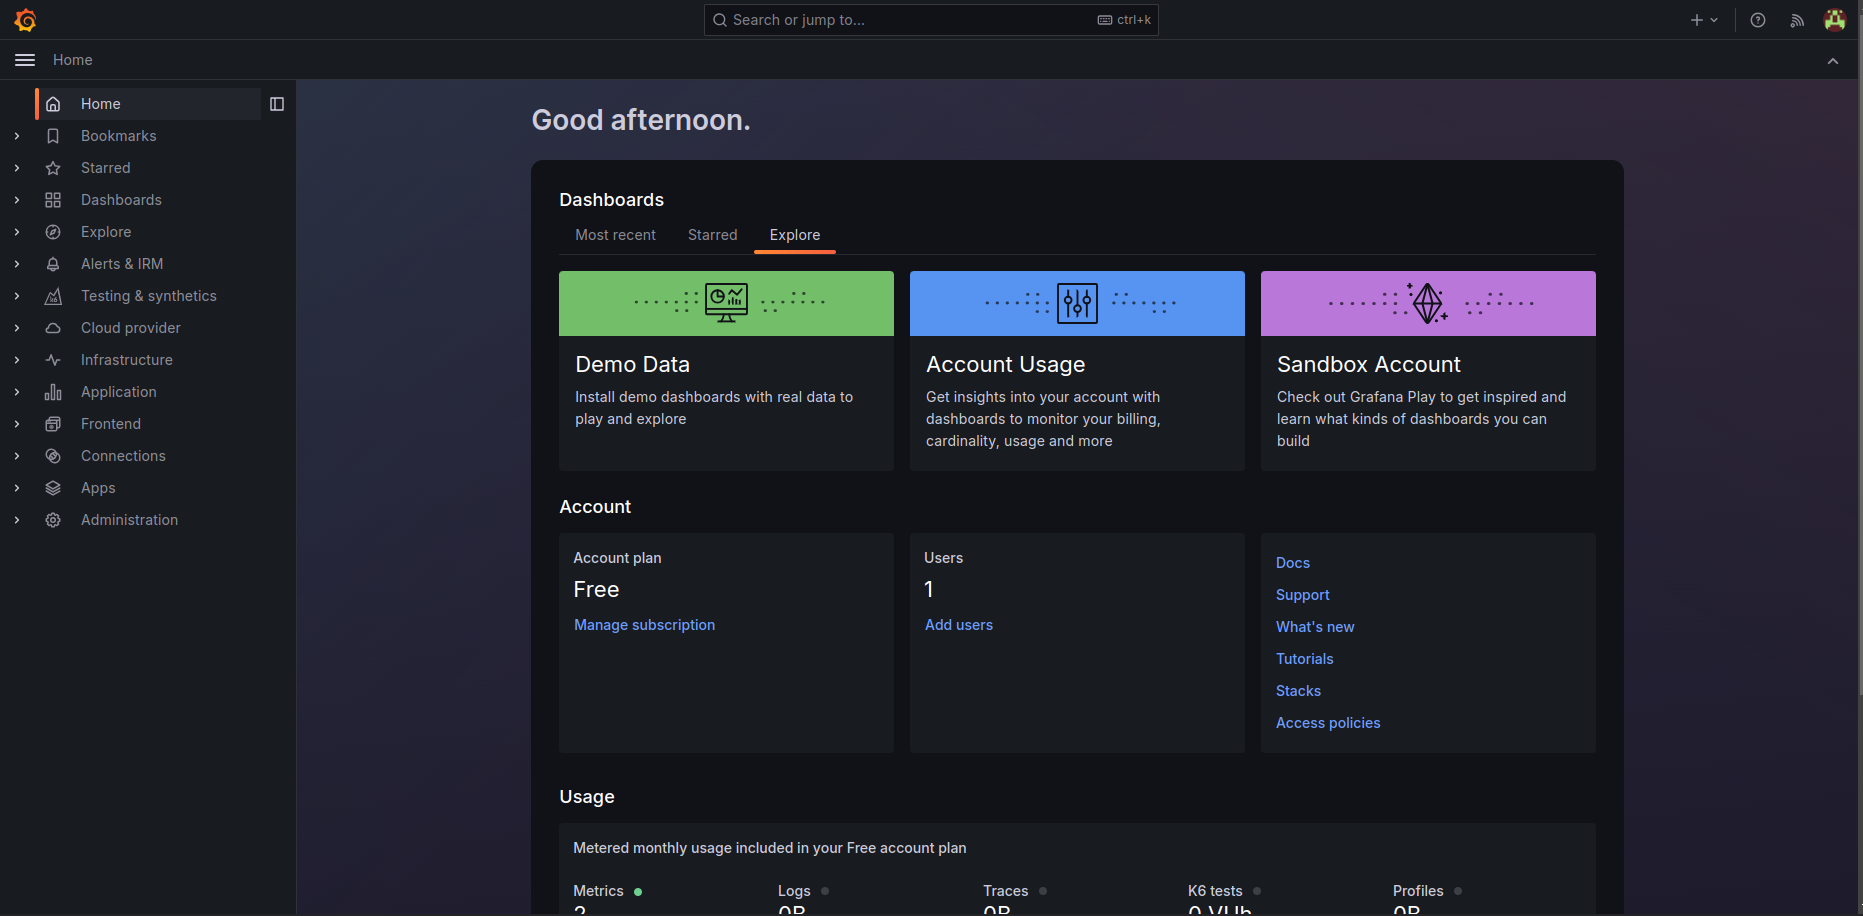
- After accessing the homepage, click on the launch stack then you need to head over to Grafana dashboard show below
Step-3: Configuration the monitoring
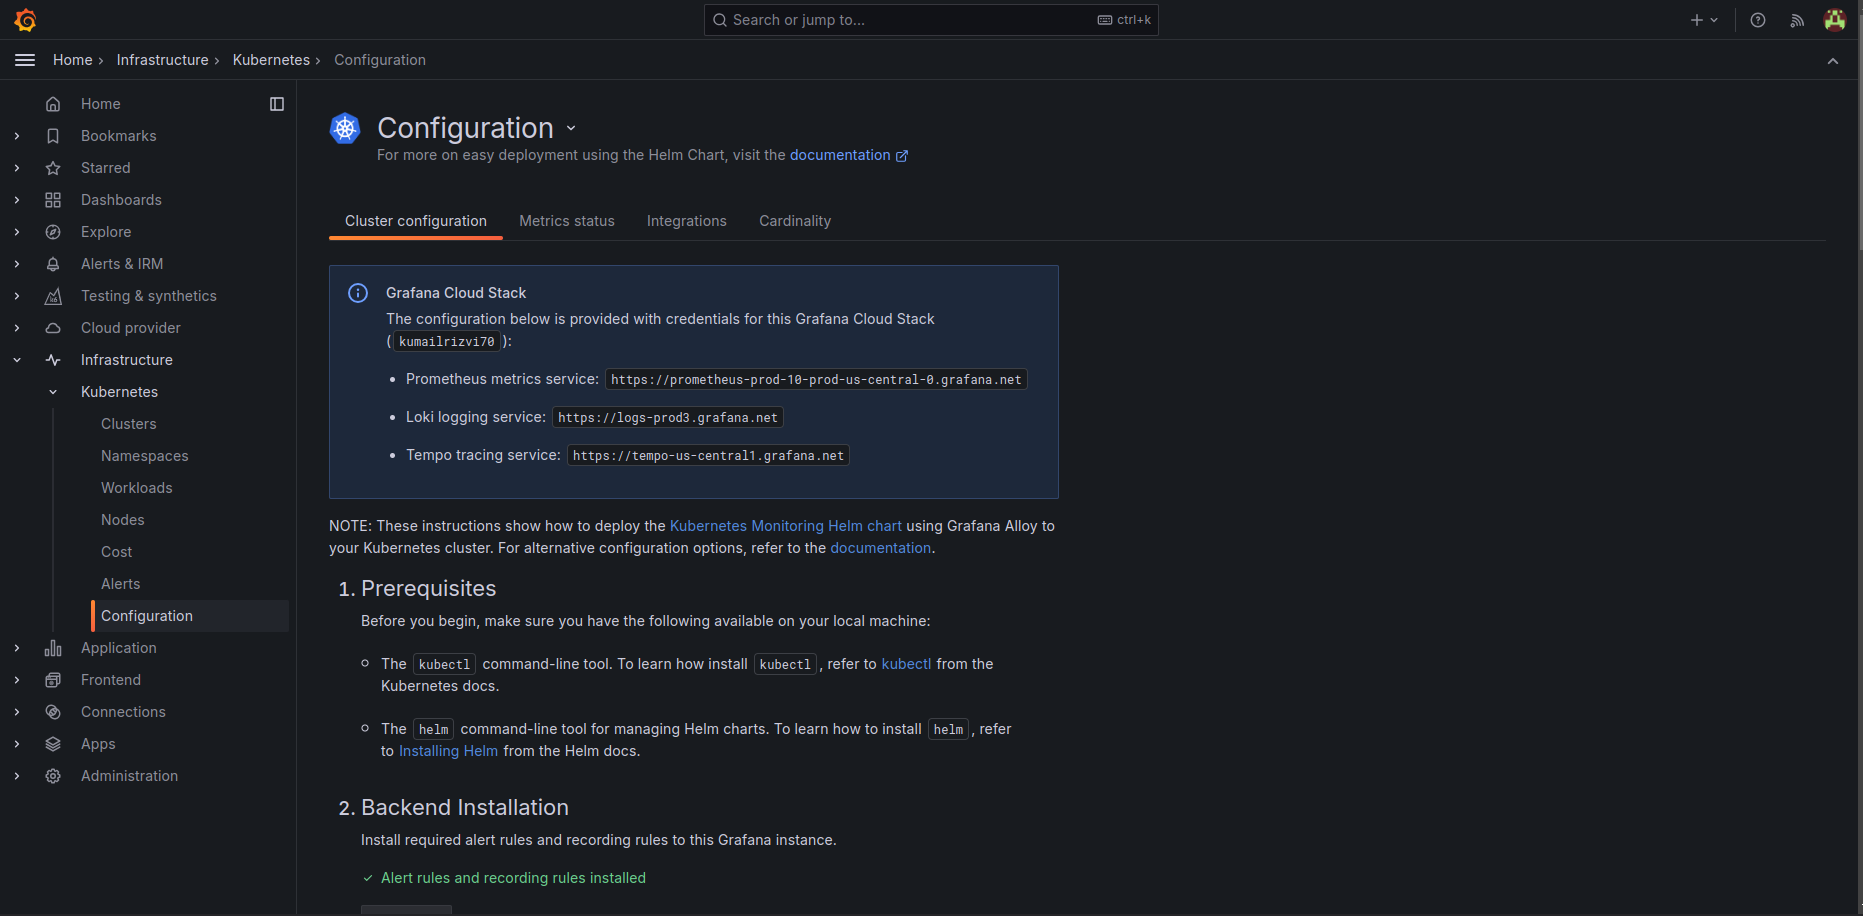
- Head over to the Infrastructure option on the left context and then click on Kubernetes, then click on configuration
NOTE
These instructions show how to deploy the Kubernetes Monitoring Helm chart using Grafana Alloy to your Kubernetes cluster. For alternative configuration options, refer to the documentation. Installation of Helm is necessary , Installing Helm
- Scroll down and you will see cluster name and namespace , so you need to fill up the cluster name and for namespace it would be great and best practice to keep monitoring stack in different namespace , so we will install this in a
Monitornamespace . - Choose
Kubernetesif you wish to install this on any local K8s setup like minikube , K3D etc - In the deploy section we will choose Helm for installation , then below you will get the commands , you just to paste the command in in your cluster and wait for the pods to be in running state, it takes few mins
- After successful installation , you should see all the pods in running state

Summary of installation
- Grafana Cloud Dashboard: Centralized visualization and analysis for Kubernetes metrics, logs, and alerts.
- Grafana Agent (Alloy): Lightweight agent to push metrics from Kubernetes to Grafana Cloud.
- Node Exporter: Collects hardware and OS-level metrics from Kubernetes nodes.
- Kepler: Monitors energy consumption across Kubernetes workloads and infrastructure.
- Prometheus: Monitors and stores Kubernetes metrics with alerting capabilities.
- cAdvisor: Analyzes resource usage at the container level within Kubernetes.
- OpenCost: Tracks and allocates costs for Kubernetes resources and services.
Step-5: Metrics Status on Grafana Cloud
-
After successful installation , head over to the grafana cloud , and click on
metrics statusthen you should see services should be up and running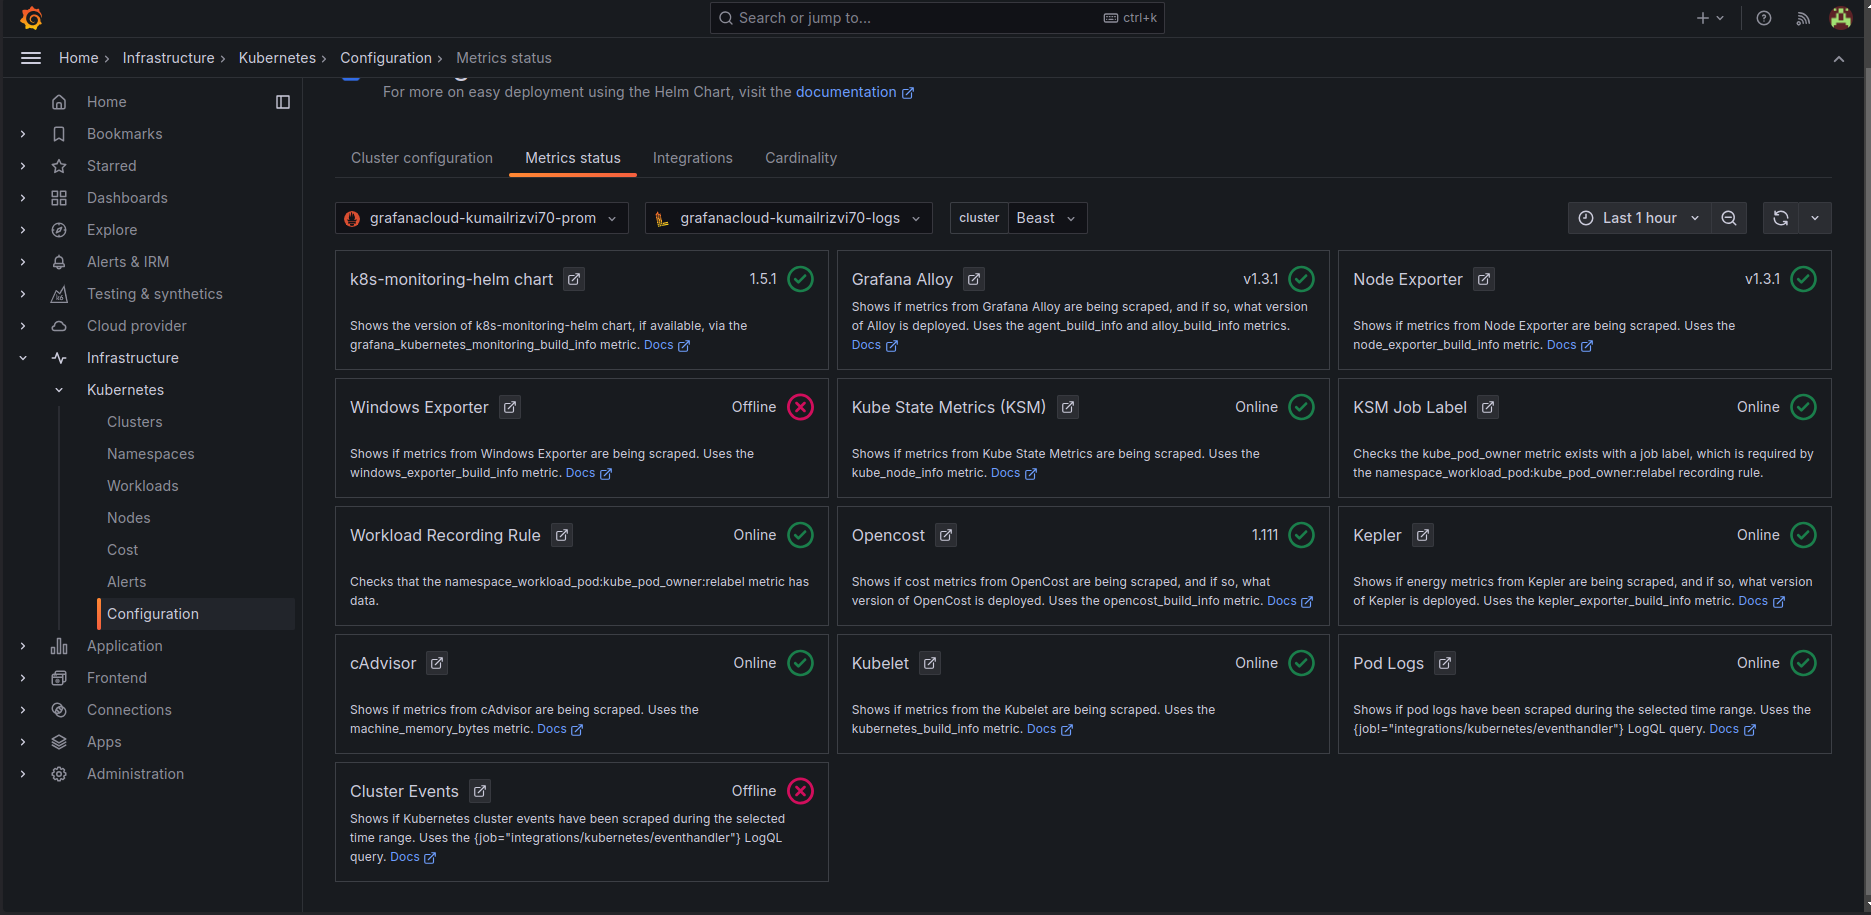
-
If services are not running, then give some times and it will be up and running and the status would be green as show in above
-
After this head over to the cluster and access the dashboard
Step-6: Visualize and Analyze
Now that everything is set up, you can start exploring your Kubernetes metrics in Grafana Cloud. You’ll see real-time insights into your cluster’s performance, including CPU and memory usage, pod health, and network traffic. You can also analyze historical trends and troubleshoot potential issues before they impact your services.
- Once everything is completed , now you will be able to see metrics in the dashboard
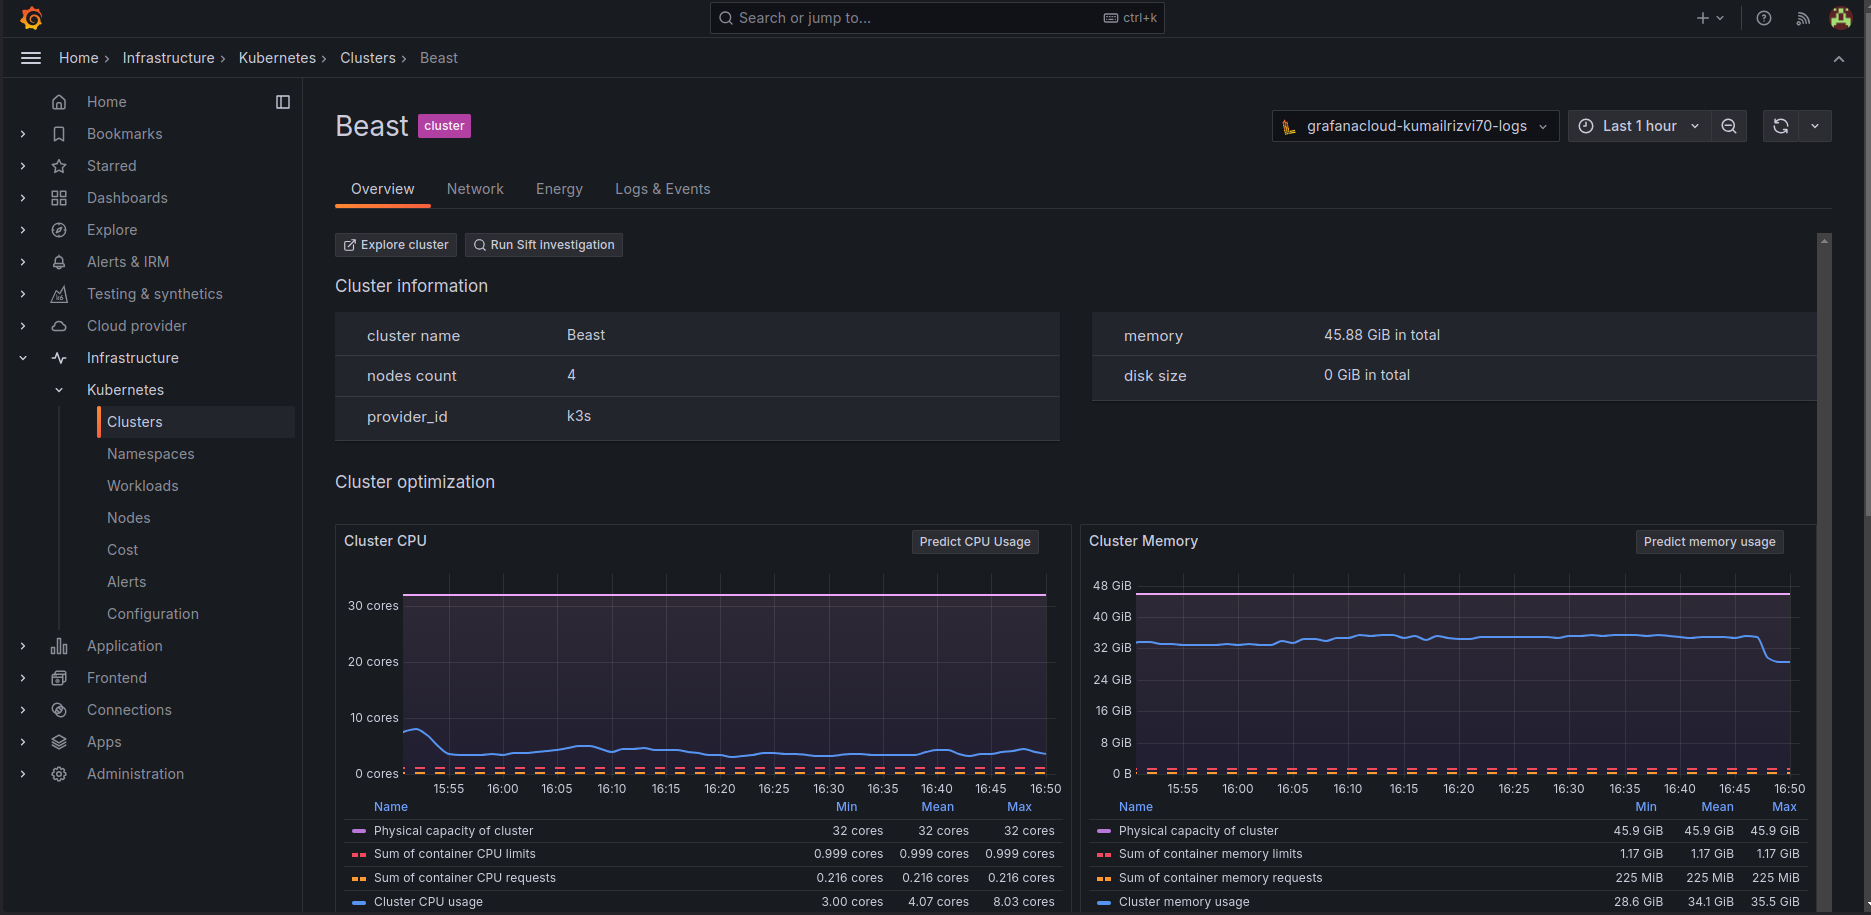
- Walk through different dashboards to know about different metrics such as cluster specific , namespace , pods specific as well
Kubernetes Overviewwould give you an great representation of your cluster
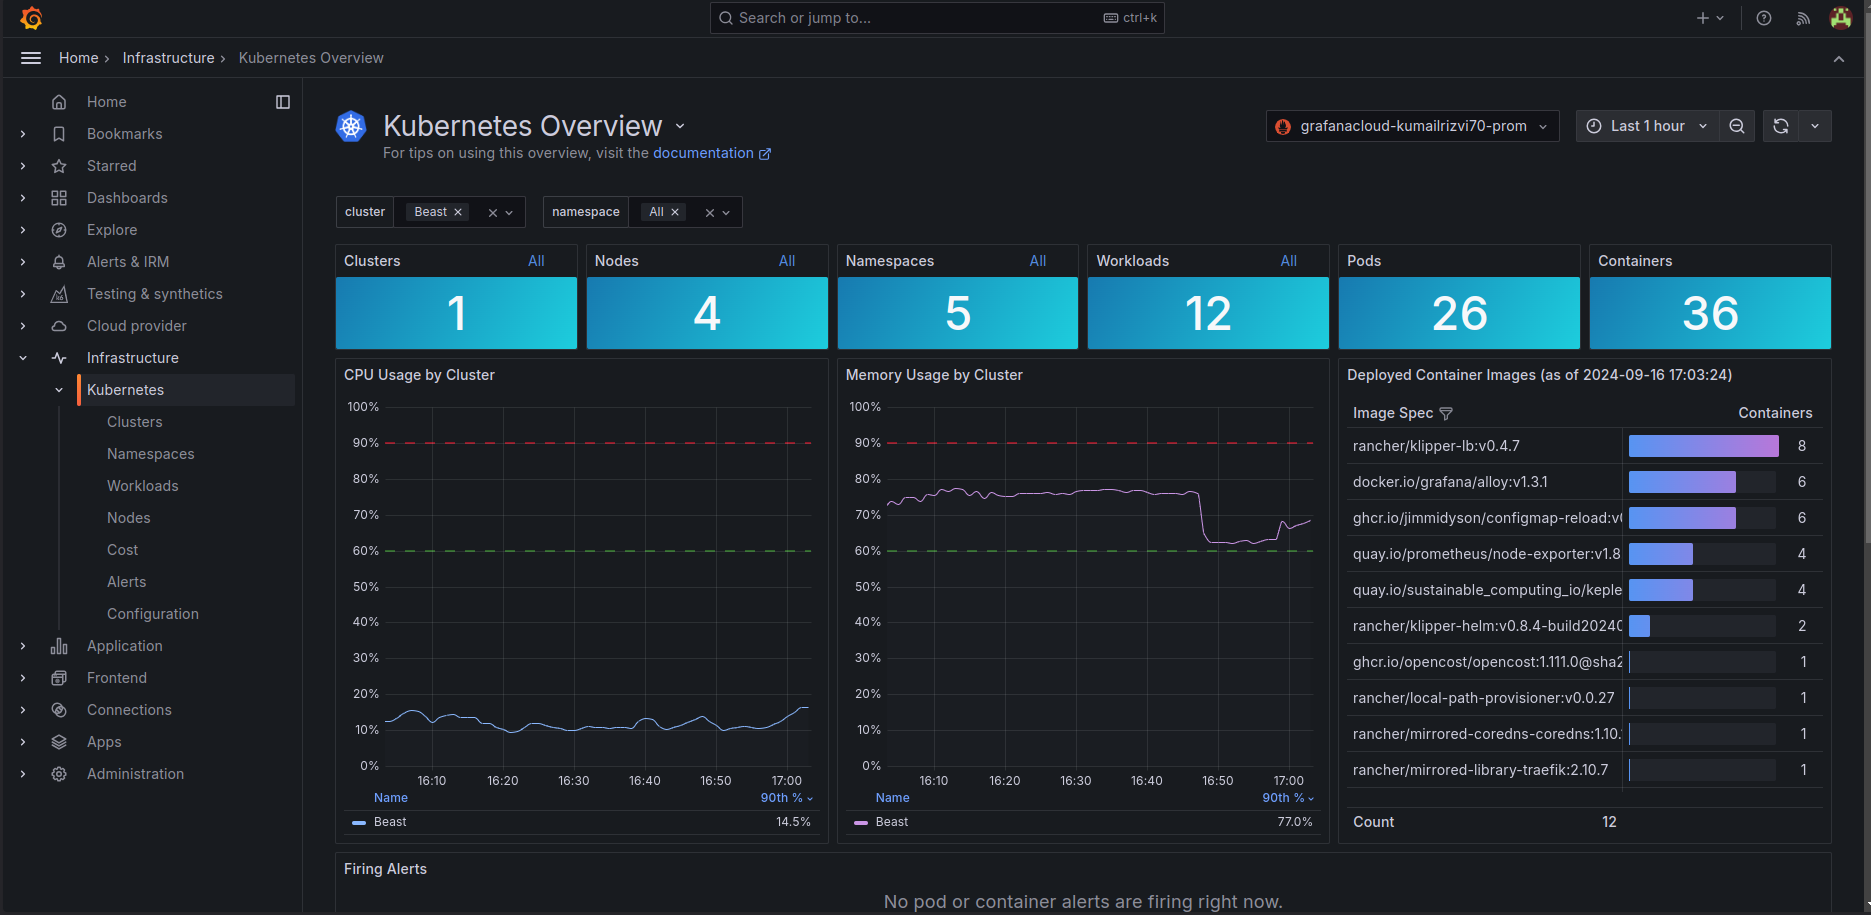
- Alerts are been setup easily as well
Best Practices for Monitoring Kubernetes with Grafana Cloud
- Monitor Everything: Ensure that every component of your Kubernetes stack (nodes, pods, services) is being monitored.
- Leverage Logs & Traces: Use Loki for logs and Tempo for traces to get a full picture of your system’s health.
- Set Alerts for Critical Metrics: Set up proactive alerts for resource over-usage, failed pods, or service disruptions.
- Automate Dashboards: Use Grafana’s templating features to create reusable dashboards for different environments or teams.
Conclusion
Grafana Cloud provides an excellent platform for monitoring Kubernetes clusters, offering an easy-to-set-up, scalable, and comprehensive observability solution. With powerful features like real-time dashboards, customizable alerts, and multi-cloud monitoring, Grafana Cloud can help you ensure your Kubernetes clusters are running smoothly and efficiently.
By following the steps outlined in this post, you can set up Kubernetes monitoring with Grafana Cloud and start gaining valuable insights into your cluster’s performance.
Ready to monitor your Kubernetes cluster with Grafana Cloud? 🚀 Start today and bring your observability to the next level!
Have you tried Grafana Cloud for your Kubernetes monitoring? Let me know your thoughts in the comments! 😊
